How to Add a Chart
Charts give you rich reporting and analysis within theLogMeIn Central workspace. Each chart is a representation of data pulled from a specific LogMeIn Central report or Alert Package.
Who can use this feature? The full set of
LogMeIn Central reports and charts is available for the following:
| Basic/Plus/Premier Subscription | Modular Subscription | User Permissions |
|---|---|---|
|
|
|
What to do next:
Moving and editing charts
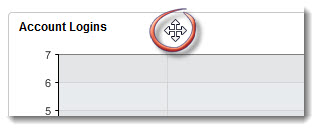
To move a chart, grab it by the header and drag it to the preferred location on the tab. You cannot move a chart to another tab.
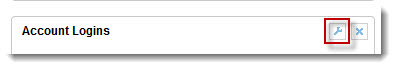
To edit a chart, click the wrench icon.
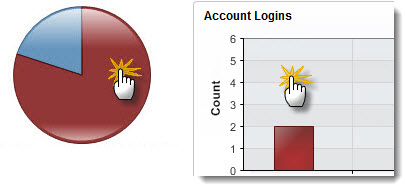
To drill-down from chart view to standard view, click anywhere in the chart space.